

Ready to Work Together?
Let's discuss how our expertise can help transform your business.


 Jul 18, 2023
.jpg)
DataDog is a powerful tool that can help your organization monitor and manage applications and infrastructure. It’s essential to be able to quickly and effectively monitor the performance and behavior of your systems. Whether you're running a single application or managing a large, complex infrastructure, DataDog provides a comprehensive suite of monitoring and analytics tools that can help you stay on top of your systems and ensure their reliability and performance.
In this article, we'll explore a few types of DataDog monitors and how they can help you stay on top of your systems. As well as how to set them up.
These monitors allow you to proactively identify and resolve issues with your applications by establishing thresholds for metric values. Then receiving alerts when those values go outside of the normal range. This allows you to take action before a minor issue becomes a major problem.
There are several types of DataDog monitors to help you monitor the health and performance of your infrastructure, applications, and services.
Three of the main types are:
Many of these monitors can be set up using the Metric Monitor template that DataDog provides.
To find this, hover your mouse over the “Monitors” tab in the left sidebar and select “New Monitor.” Then select “Metric Monitor” in the options that appear.
The DataDog Metric Monitor template will go through a list of steps to customize your monitor.

For other types of monitors that can be created using this same template, you would edit the metric and alert conditions. Here is an example of a Memory Usage monitor to alert when a host is almost out of usable memory.
A synthetic test is another type of monitor that you can create. These are located in the “UX Monitoring” tab in the left sidebar.
These synthetic monitors will send requests to endpoints where you can add tests for what the status, headers, body, etc., contains or equals.
Creating a new synthetic test will walk you through similar steps as creating a monitor.
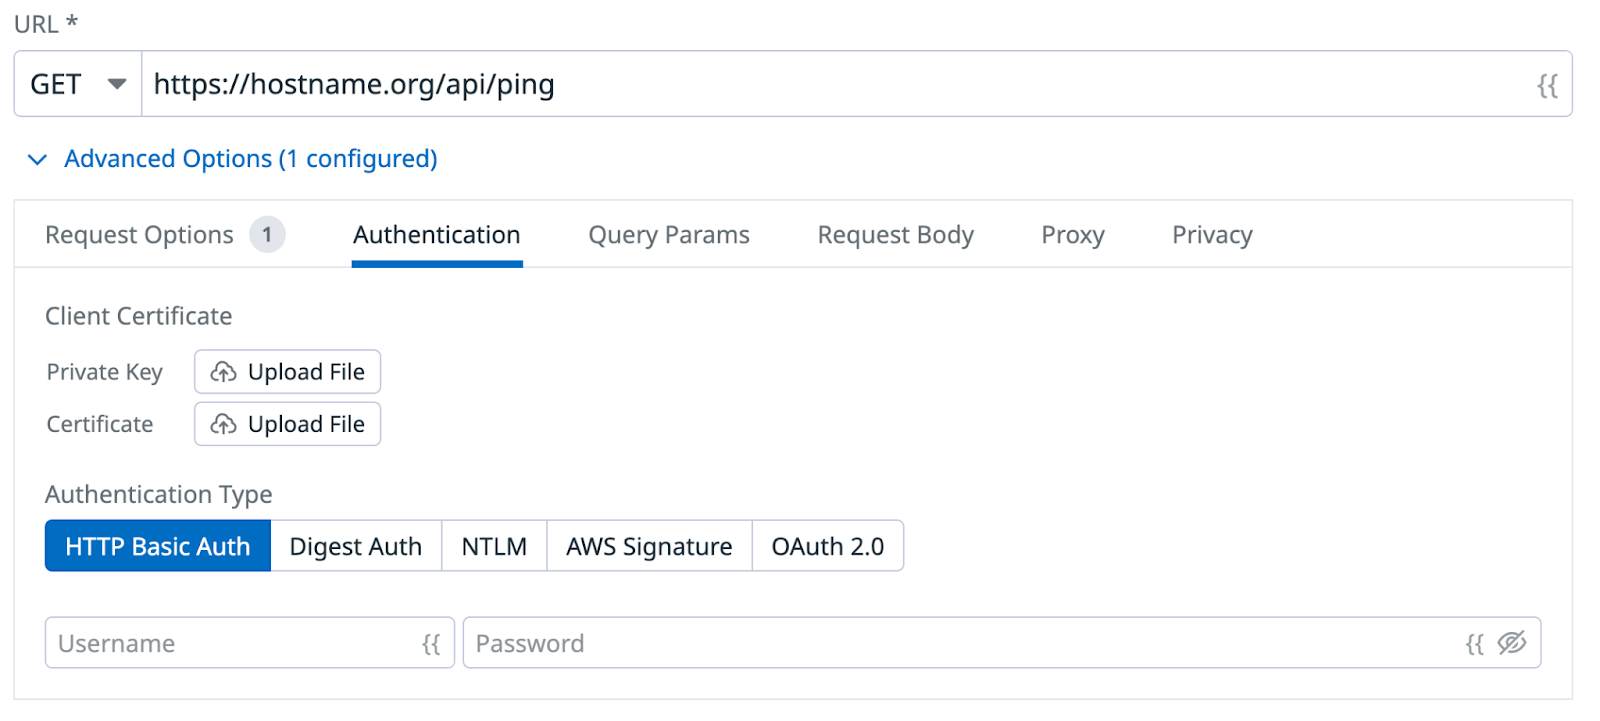
The following steps are setting locations that the synthetic test is running in, number of times it will retry before alerting, and scheduling how frequently it is run.
The final step is writing an alert message where you can add app integrations such as Slack channels for the alert to be sent to, the same as in creating a monitor.
If you’d like additional help with DataDog, observability, or application development, NextLink Labs is here to help.
Learn more about our DevOps Consulting service.
Or read more about how to set up DataDog observability in PHP applications.
 Custom Software Development
One account becomes five, and eventually nobody knows which guardrails are where. Here's how NextLink Labs manages AWS Organizations, OU hierarchies, and Service Control Policies with Terraform and GitLab CI.
 Colin Soleim
·
Apr 22, 2026
Colin Soleim
·
Apr 22, 2026
 Custom Software Development
A backdoored Axios package. A poisoned LiteLLM release. Both live for hours. A dependency cooldown would have blocked them both. Here's how to protect your Rails app with gem.coop, Dependabot, and Bundler checksums.
Colin Soleim
·
Apr 6, 2026
 Custom Software Development
Large Rails monoliths burn millions of tokens per AI session. These 5 architectural changes cut costs and boost AI suggestion quality by 3-4x.
Colin Soleim
·
Feb 19, 2026
.png) Custom Software Development
Custom Software Development
How to Setup Ruby's YJIT Compiler in Your Rails Application
Colin Soleim
·
Mar 28, 2024